
I mentioned these tools in the My Monitoring Journey: Cacti, Graphite, Grafana & Chronograf post and thought now would be a good time to cover their installation and setup. Let’s get started.
Installing InfluxDB & Telegraf
Instructions on how to install all of the TICK stack components can be found here. As I’m running Ubuntu, I’ll need to run these commands:
wget https://dl.influxdata.com/influxdb/releases/influxdb_1.2.4_amd64.deb
sudo dpkg -i influxdb_1.2.4_amd64.deb
wget https://dl.influxdata.com/telegraf/releases/telegraf_1.3.1-1_amd64.deb
sudo dpkg -i telegraf_1.3.1-1_amd64.deb
Note that after running the last command, the Telegraf service automatically starts:
will@ubuntu:/tmp$ sudo dpkg -i telegraf_1.3.1-1_amd64.deb
Selecting previously unselected package telegraf.
(Reading database ... 177117 files and directories currently installed.)
Preparing to unpack telegraf_1.3.1-1_amd64.deb ...
Unpacking telegraf (1.3.1-1) ...
Setting up telegraf (1.3.1-1) ...
Created symlink from /etc/systemd/system/multi-user.target.wants/telegraf.service to /lib/systemd/system/telegraf.service.
The same is not true for InfluxDB, and therefore it must be started manually. To avoid having to do this every time you reboot your machine, you can also make it start at boot time:
sudo systemctl enable influxdb
sudo systemctl start influxdb
systemctl status influxdb
After issuing the last command, you may see something like this:
Jun 09 04:28:58 ubuntu influxd[4039]: [I] 2017-06-09T11:28:58Z Starting HTTP service service=httpd
Jun 09 04:28:58 ubuntu influxd[4039]: [I] 2017-06-09T11:28:58Z Authentication enabled:false service=httpd
Jun 09 04:28:58 ubuntu influxd[4039]: [I] 2017-06-09T11:28:58Z Listening on HTTP:[::]:8086 service=httpd
Jun 09 04:28:58 ubuntu influxd[4039]: [I] 2017-06-09T11:28:58Z Starting retention policy enforcement service with check interval of 30m0s service=retention
Jun 09 04:28:58 ubuntu influxd[4039]: [I] 2017-06-09T11:28:58Z Listening for signals
Jun 09 04:28:58 ubuntu influxd[4039]: [I] 2017-06-09T11:28:58Z Storing statistics in database '_internal' retention policy 'monitor', at interval 10s service=monitor
Jun 09 04:28:58 ubuntu influxd[4039]: [I] 2017-06-09T11:28:58Z Sending usage statistics to usage.influxdata.com
Jun 09 04:29:00 ubuntu influxd[4039]: [httpd] 127.0.0.1 - - [09/Jun/2017:04:29:00 -0700] "POST /write?consistency=any&db=telegraf HTTP/1.1" 404 69 "-" "-" d560316c-4d06-11e7-8001-000000000000 1465
Jun 09 04:29:00 ubuntu influxd[4039]: [I] 2017-06-09T11:29:00Z CREATE DATABASE telegraf service=query
Jun 09 04:29:00 ubuntu influxd[4039]: [httpd] 127.0.0.1 - - [09/Jun/2017:04:29:00 -0700] "POST /query?q=CREATE+DATABASE+%22telegraf%22 HTTP/1.1" 200 62 "-" "-" d560a589-4d06-11e7-8002-000000000000 6018
What’s this talk of Telegraf you ask? Well, Telegraf is set up to automatically create an InfluxDB database and write the details of the system which it is installed on (CPU, RAM, etc) to that database. Let’s pause this discussion for a moment though and now look into configuring InfluxDB and Telegraf.
Update: See the Getting to know Telegraf post for information on the statistics which are gathered by Telegraf by default.
Configuring InfluxDB & Telegraf
InfuxDB configuration files is /etc/influxdb/influxdb.conf.
What we need to do is find the HTTP authentication line, uncomment it and change it to true, like so:
  # Determines whether HTTP authentication is enabled.
  auth-enabled = true
Next we need to set up a username and password in InfluxDB, like so:
$ influx
> CREATE USER "influx" WITH PASSWORD 'influx_pass' WITH ALL PRIVILEGES
Now it’s time to restart the InfluxDB service:
sudo systemctl restart influxdb
Configuring Telegraf
Now that we’ve password protected InfluxDB, Telegraf will no longer be able to write data to it. To rectify this, we’ll need to edit Telegraf’s configuration file, /etc/telegraf/telegraf.conf .
In the above mentioned file, we need to locate the [[outputs.influxdb]] section, uncomment the username and password lines and make sure their values match those which we set in InfluxDB:
  username = "influx"
  password = "influx_pass"
Now it’s time to restart the Telegraf service:
sudo systemctl restart telegraf
Installing Grafana
As per the Grafana website, installing Grafana is as easy as issuing these commands:
wget https://s3-us-west-2.amazonaws.com/grafana-releases/release/grafana_4.3.1_amd64.deb
sudo apt-get install -y adduser libfontconfig
sudo dpkg -i grafana_4.3.1_amd64.deb
We the need to issue the below commands in order to start Grafana and ensure it starts automatically after reboots:
sudo /bin/systemctl enable grafana-server
sudo /bin/systemctl start grafana-server
sudo /bin/systemctl daemon-reload
Configuring Grafana
To configure Grafana we need to browse to http://:3000/login and log in with the username admin and password admin .
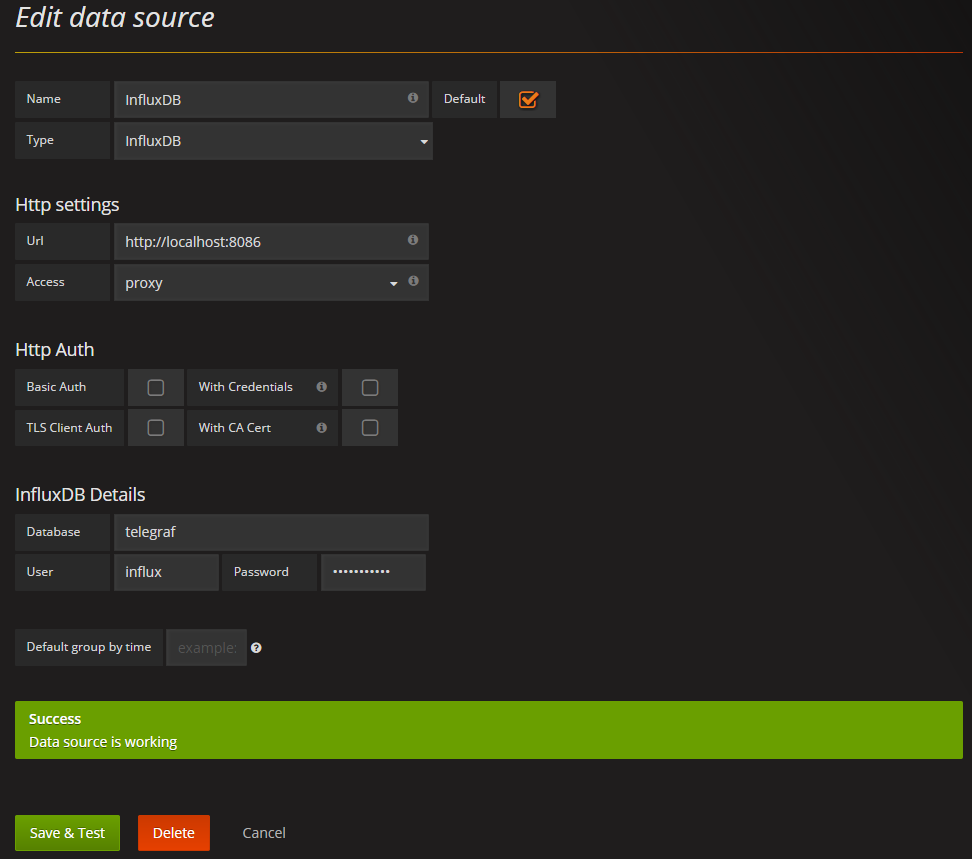
Once in, we’ll need to click on the “Create your first data source” link and then enter the details of our InfluxDB server. Once done, clicking “Save & Test” should result in a “Success” message appearing.
Now that we’ve connected Grafana to our InfluxDB database, we’re able to create graphs using the data Telegraf has been recording, like so:
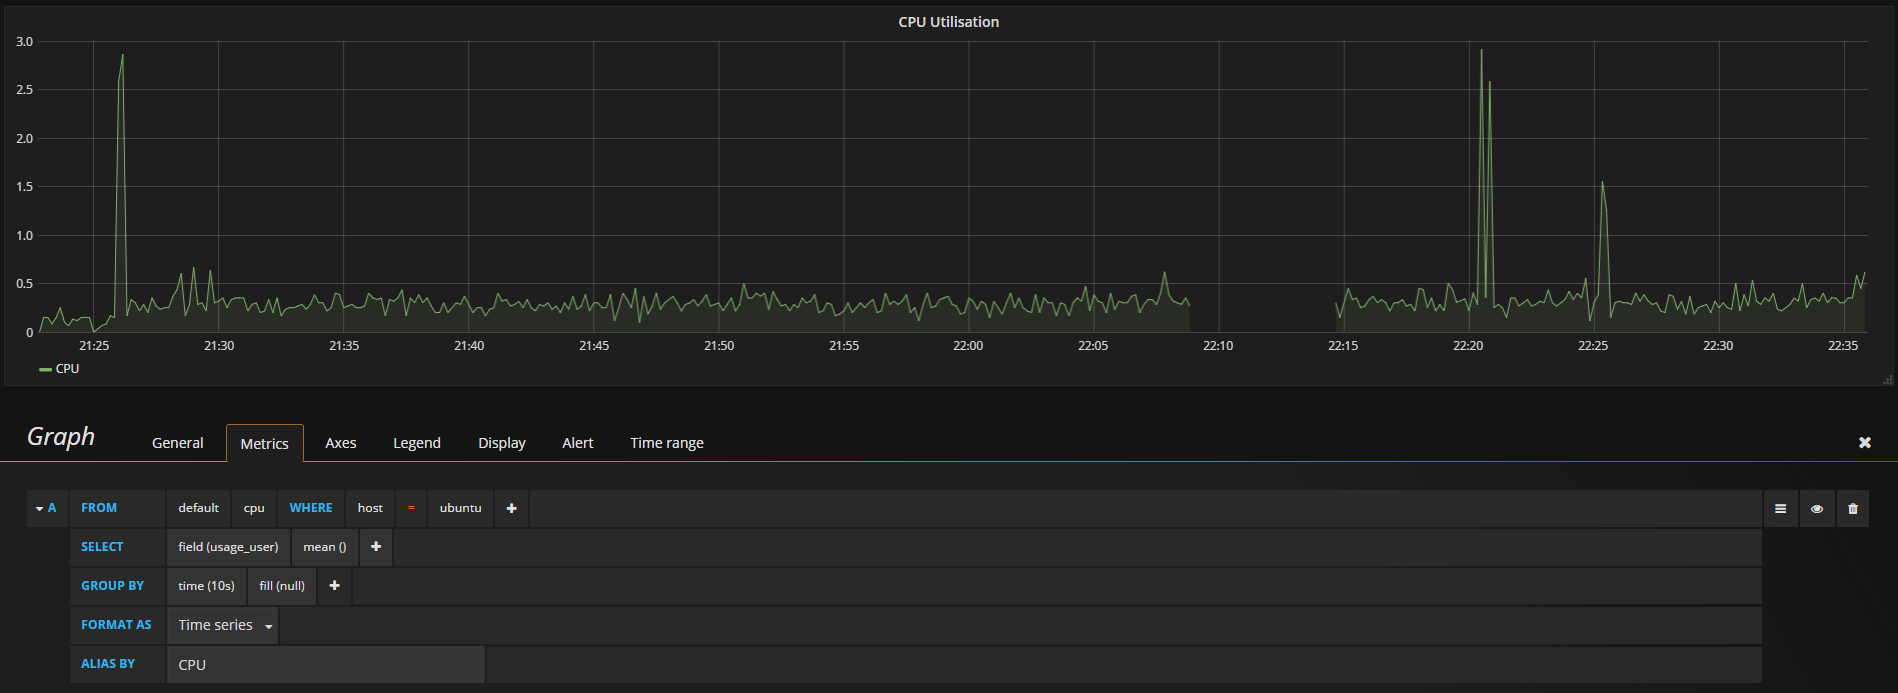
Note that the gap in the graph shows the point in time where I enabled authentication on InfluxDB. Once I added the credentials to Telegraf it was again able to populate the database.
Further Reading
- InfluxDB posts
- Telegraf posts
- Grafana posts
- Monitoring posts
As always, if you have any questions or have a topic that you would like me to discuss, please feel free to post a comment at the bottom of this blog entry, e-mail at will@oznetnerd.com, or drop me a message on Reddit (OzNetNerd).
Note: The opinions expressed in this blog are my own and not those of my employer.

Leave a comment