
I’ve used Grafana for several years. Ever since the first time I used it, I have wanted to sit down and write a server which would provide metrics to it through the Simple JSON datasource plugin. I’m happy to announce that I have finally gotten around to doing just that. The tool is called PyGraf and will be opened sourced in the very near future!
In the meantime, I’d like to share my findings as there’s not a lot of documentation on the topic.
Backend URLs
The Simple JSON docs tells us that our backend must support the following endpoints:
/should return 200 ok. Used for “Test connection” on the datasource config page./searchused by the find metric options on the query tab in panels./queryshould return metrics based on input./annotationsshould return annotations.
That’s great to know, but how do we go about testing them? Let’s run through that now.
Root endpoint
/ is used when configuring our datasource in Grafana. When we click “Save & Test”, Grafana sends a GET / request to our backend. If our backend responds, Grafana will confirm that the test worked.
Here’s what the datasource configuration looks like:
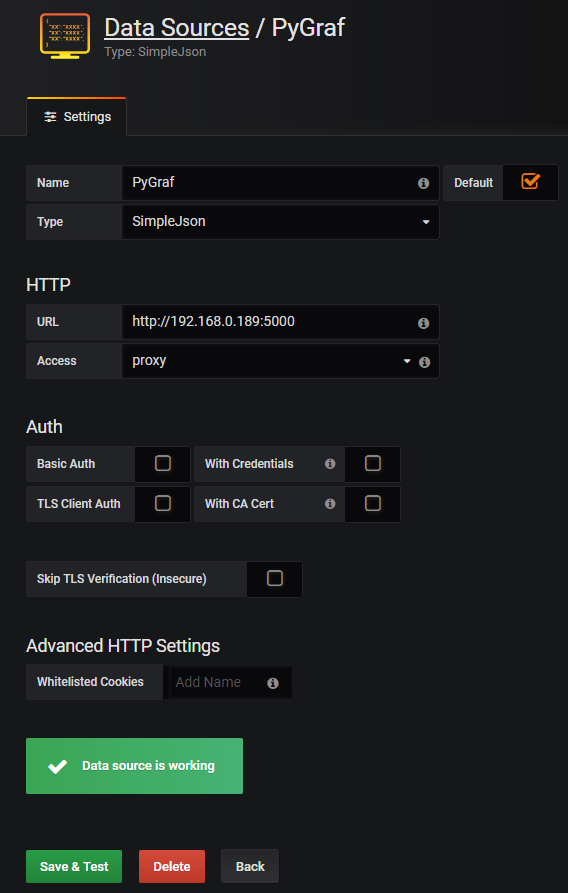
And here’s the Flask webserver logs showing Grafana’s GET request:
172.17.0.2 - - [15/Apr/2018 14:56:49] "GET / HTTP/1.1" 200 -
And finally, here’s the Python code that is provides the / endpoint.
@app.route("/")
def index():
    return "OK"
Search endpoint
/search is used to populate the list of hosts which we can graph against, as shown in the image below.
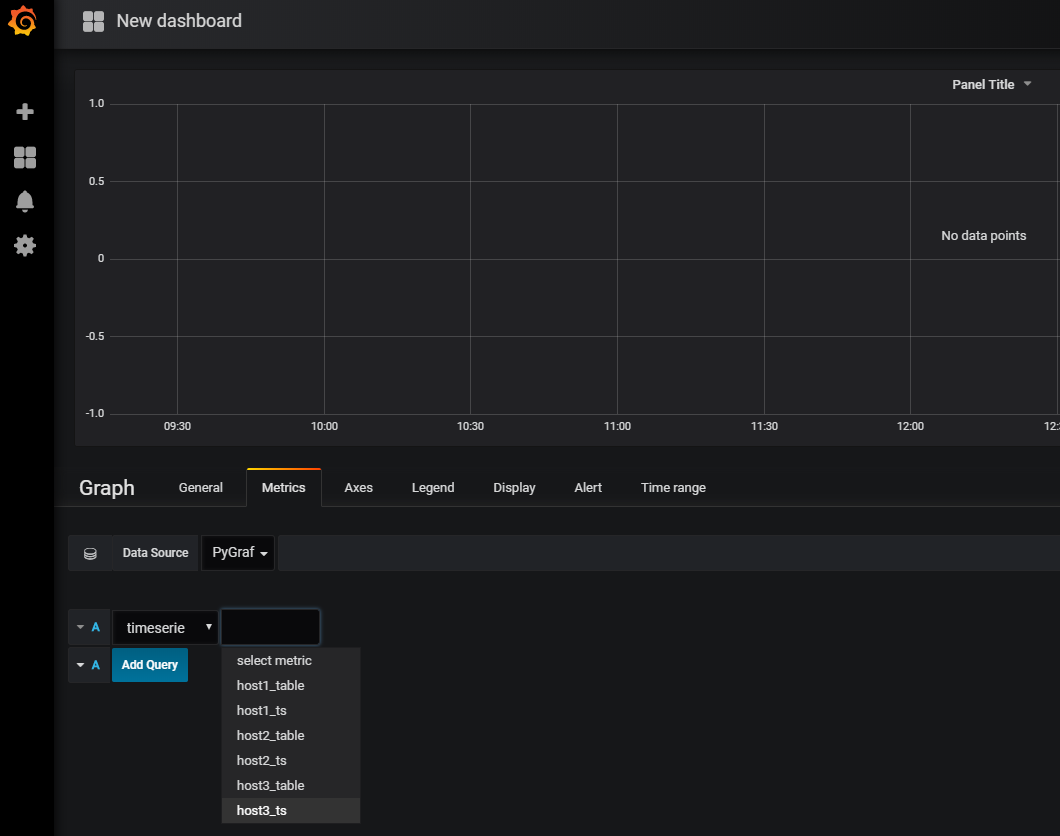
Though the documentation gives us the following example request:
{ target: 'upper_50' }
It’s important to note that the target will sometimes have no value, like so:
172.17.0.2 - - [15/Apr/2018 15:22:40] "POST /search HTTP/1.1" 200 -
{
    "target": ""
}
Not accounting for this in our backend’s code would result in a Exception being raised.
Let’s now look at PyGraf’s code for the /search endpoint:
@app.route("/search", methods=["POST"])
def grafana_search():
    targets = find_targets()
    return json.dumps(targets)
There are quite a few differences between this snippet and the one we saw earlier, so let’s go through them:
- We enable our server to receiving Grafana’s
POSTon the/searchendpoint. This wasn’t required with our/endpoint as Flask receivesGETrequests by default. - We call a function (
find_targets()) that retrieves a list of hosts we have metrics for. - We serialise the list of hosts in JSON and send it to Grafana.
Query endpoint
Grafana sends a query to our /query endpoint. As we’ll see in a moment, the query contains a date range and list of hosts which Grafana would like metrics for. Upon receiving the backend’s response, Grafana generates a graph:
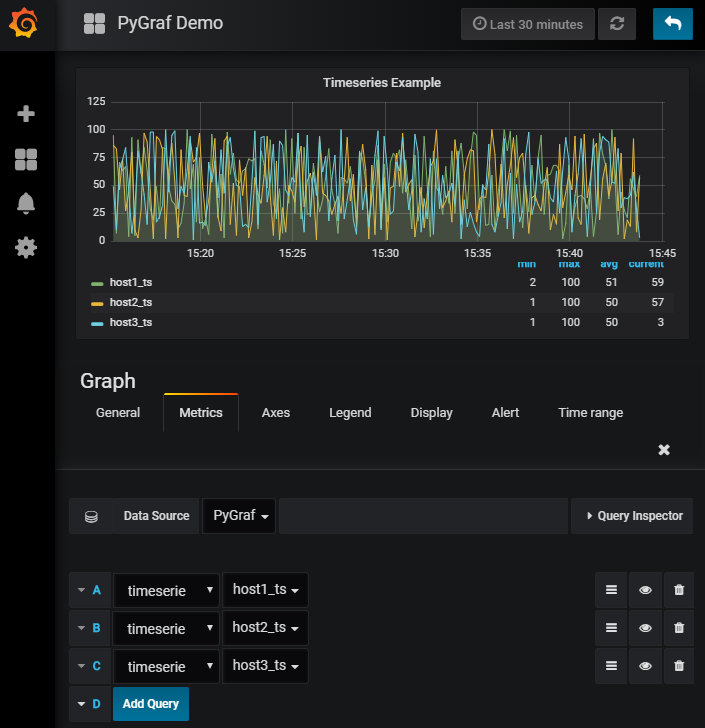
The logic required to satisfy the/query endpoint is more involved than that of the preceding endpoints. Therefore, we’re going to have to go deep!
Query endpoint Deep Dive
Below is an example of a query:
{
    "timezone": "browser",
    "panelId": 2,
    "range": {
        "from": "2018-04-15T04:57:48.126Z",
        "to": "2018-04-15T05:42:32.733Z",
        "raw": {
            "from": "2018-04-15T04:57:48.126Z",
            "to": "2018-04-15T05:42:32.733Z"
        }
    },
    "rangeRaw": {
        "from": "2018-04-15T04:57:48.126Z",
        "to": "2018-04-15T05:42:32.733Z"
    },
    "interval": "2s",
    "intervalMs": 2000,
    "targets": [
        {
            "target": "host1_ts",
            "refId": "A",
            "type": "timeserie"
        }
    ],
    "maxDataPoints": 928,
    "scopedVars": {
        "__interval": {
            "text": "2s",
            "value": "2s"
        },
        "__interval_ms": {
            "text": 2000,
            "value": 2000
        }
    }
}
The areas of most concern to us are:
from and to
These are combined dates and times in UTC (ISO 8601). This is always the case regardless of what timezones the users’ browsers and Grafana server reside in.
interval and intervalMs
The gap between datapoints that Grafana expects to receive. For example, if we select “Last 5 minutes”, Grafana will expect datapoints to be 200ms apart. If we select “Last 1 year”, it’ll expect them to be 12 hours apart.
This is done because it is more efficient. It simply wouldn’t be possible to view 1 years worth of datapoints if they were 200ms apart. Using 12 hour intervals therefore makes much more sense. Furthermore, retrieving one years worth of datapoints which are 200ms apart would put a heavy load on our backend and will likely crash the users’ browsers.
Note: It is up to us to configure our backend to honour the interval. Grafana will graph all datapoints it is given, even if they are not spaced in accordance with the expected interval.
Target and Type
As its name suggests, name specifies the name of the target Grafana is retrieving metrics for.
type describes the way in which the information will be displayed. This will either be timserie for timeseries graphs or table for tables. This is important as they each require data formatted in different ways.
maxDataPoints
maxDataPoints is used to set a ceiling on the maximum number of datapoints which are provided by our backend. This is required because, as mentioned in the interval section above, providing too many datapoints can crash users’ browsers.
It is important to note that both the intervals and max are automatically adjusted in accordance with the users’ browser size. For example, if a user sets the date range to “This week” with their browser maximised, the interval will be 10m and the max may be set to 928. If they then decrease the size of their browser and refreshed the graph, the interval will be increased to 30m and maxDataPoints decreased to perhaps 302.
As mentioned in the intervals section of this post, Grafana does this because it provides clearer results. For example, more datapoints with shorter intervals are required on a 40” screen than would be required for a 15” screen as the former is capable of displaying more data than the latter.
Note: It is up to us to configure our backend to honour maxDataPoints. Grafana will graph all datapoints it is given, even if they exceed the max. As has been mentioned a few times already, not honouring the limit may result in users’ browsers crashing.
Epoch & Datapoint timestamps
Earlier in this post it was mentioned that Grafana provides dates and times in UTC (ISO 8601). However, what hasn’t been mentioned yet is the fact that our datapoints must be provided with Unix epoch times. As explained by epoch converter:
The Unix epoch (or Unix time or POSIX time or Unix timestamp) is the number of seconds that have elapsed since January 1, 1970 (midnight UTC/GMT), not counting leap seconds (in ISO 8601: 1970-01-01T00:00:00Z). Literally speaking the epoch is Unix time 0 (midnight 1/1/1970), but ‘epoch’ is often used as a synonym for ‘Unix time’. Many Unix systems store epoch dates as a signed 32-bit integer, which might cause problems on January 19, 2038 (known as the Year 2038 problem or Y2038).
Below is an example of epoch times which are 10 milliseconds apart, alongside their corresponding datapoints:
1523770967000,44
1523770977000,28
1523770987000,21
1523770997000,56
1523771007000,47
1523771017000,40
So how do we bridge the gap between the ISO 8601 date times and the epoch times? We convert the former to the latter!
PyGraf uses the following function to do just that:
def to_epoch(dt_format):
    epoch = int((datetime.strptime(dt_format, "%Y-%m-%dT%H:%M:%S.%fZ") - datetime(1970, 1, 1)).total_seconds()) * 1000

    return epoch
By passing Grafana’s from and to ISO 8601 date times to this function, we’ll get their epoch equivalents. Now that we’ve got the date range and the datapoints using the same time format, we simply need to find points which fall within that range and provide them to Grafana.
Good luck!
And that’s all we have time for today! Hopefully this post is enough to bridge the gap between the docs and your backends. If it isn’t though, please feel free to drop me an email and I’ll be more than happy to give you a hand.
As always, if you have any questions or have a topic that you would like me to discuss, please feel free to post a comment at the bottom of this blog entry, e-mail at will@oznetnerd.com, or drop me a message on Reddit (OzNetNerd).
Note: The opinions expressed in this blog are my own and not those of my employer.

Leave a comment